Global Metabolic Crisis
Explore the Crisis by Region
Start with the map, then move into regional, national, and subregional pages about diet transition, chronic disease, ancestry, urbanization, and food systems.
2025 turning point: childhood obesity now exceeds underweight
In 2025, obesity became more prevalent than underweight worldwide among children and adolescents aged 5–19. UNICEF estimates that 9.4%—about 188 million young people—are living with obesity, compared with 9.2%—about 184 million—living with underweight. Obesity now exceeds underweight in every world region except sub-Saharan Africa and South Asia.
The global crossover
Obesity: 3.0% in 2000 → 9.4% in 2025
Underweight: nearly 13% in 2000 → 9.2% in 2025
This is not simply a story of affluent countries. Low- and middle-income countries now account for more than 80% of all children and adolescents aged 5–19 living with overweight. UNICEF links the rise to food environments in which inexpensive, aggressively marketed ultra-processed foods and sugary drinks are often easier to obtain than nutritious foods.
What the 2050 forecast shows
A 2025 Lancet analysis for the Global Burden of Disease Study estimated that 493 million people aged 5–24 were living with overweight or obesity in 2021, including 174 million with obesity. If current trends continue, the study forecasts 746 million with overweight or obesity by 2050, including approximately 360 million with obesity.
- 2021 observed estimate: 493 million aged 5–24 with overweight or obesity; 174 million with obesity.
- 2050 reference forecast: 746 million with overweight or obesity; 360 million with obesity.
- Fastest transitions: especially serious increases are forecast in parts of Oceania, South and Southeast Asia, Latin America and the Caribbean, and North Africa and the Middle East.
These two studies use different age ranges and methods, so their totals should not be compared as if they were the same dataset. UNICEF describes the 2025 global crossover among ages 5–19; the Lancet study models ages 5–24 and forecasts future trends.
Primary sources and graphics
- UNICEF Child Nutrition Report 2025: Feeding Profit — global data, trends, inequities and food-environment findings.
- The Lancet / Global Burden of Disease Study 2021 — observed 1990–2021 estimates, world maps and forecasts to 2050.
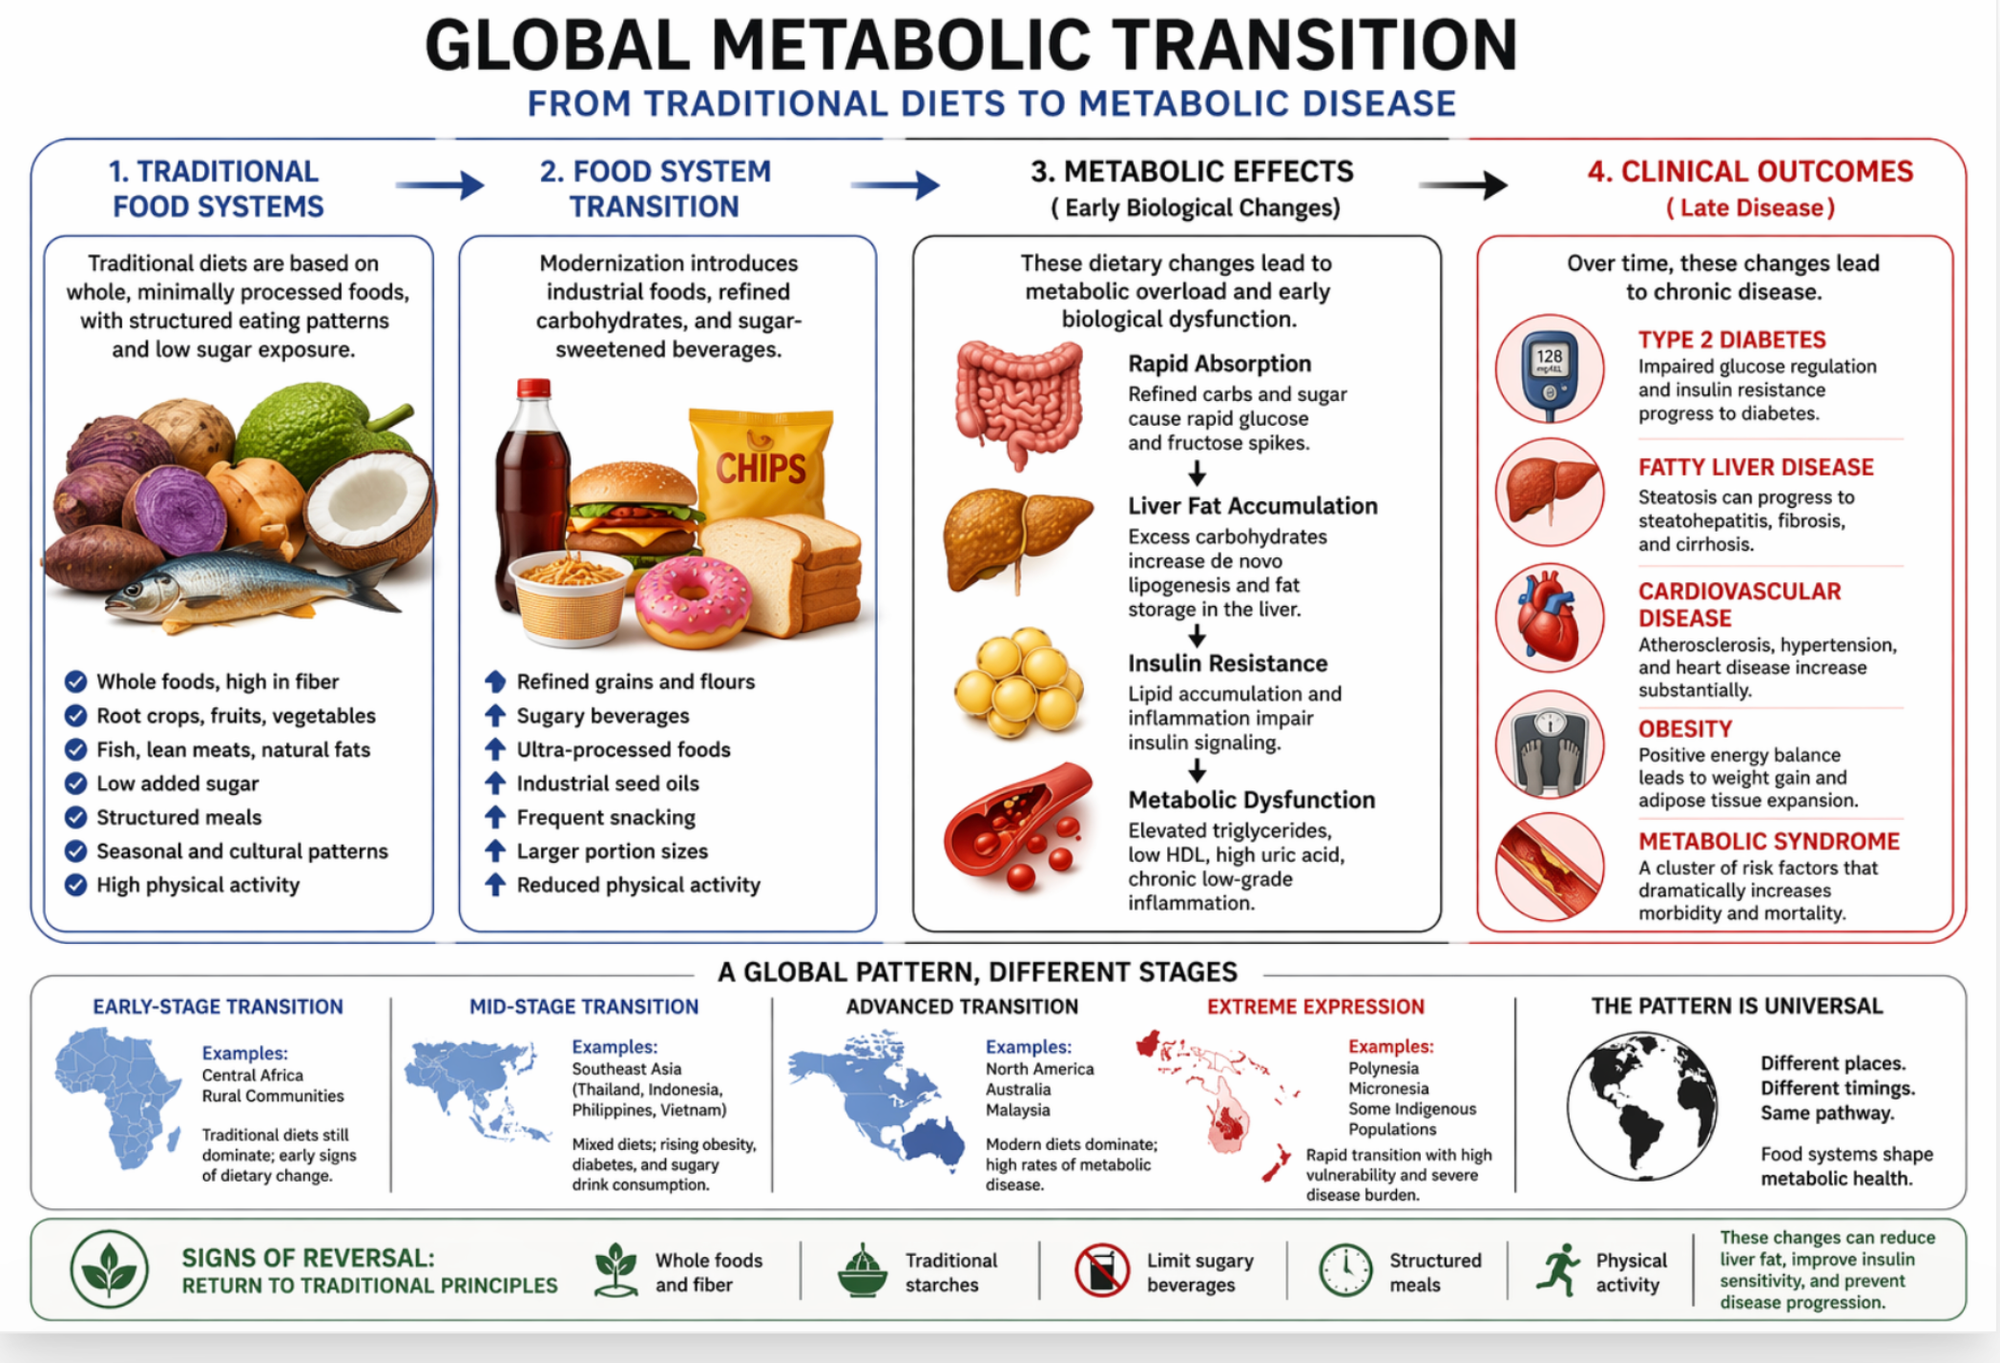
Over the past 50–70 years, a profound shift has occurred in human health. Across continents, populations that once thrived on traditional diets are now experiencing unprecedented rates of obesity, type 2 diabetes, and fatty liver disease. This is not a coincidence. It is the result of a rapid environmental change colliding with biology that evolved under very different conditions.
At the center of this transformation is the global spread of ultra-processed foods—particularly those rich in refined sugars and high-fructose corn syrup. Unlike glucose, which is metabolized broadly throughout the body, fructose is handled primarily by the liver. In ancestral environments, this pathway was rarely stressed. Today, it is overwhelmed.
The result is a predictable pattern: hepatic fat accumulation, insulin resistance, rising uric acid, and downstream cardiometabolic disease. What we are witnessing is not a failure of individuals—it is a mismatch between ancient genes and a modern food environment.
The Changing Geography of Global Obesity, 1980–2024
A 2026 analysis by the NCD Risk Factor Collaboration (NCD-RisC) combined 4,050 population-based studies involving 232 million participants across 200 countries and territories. It estimated national obesity prevalence and the annual rate of change—described as obesity “velocity”—from 1980 through 2024.
The central finding is more precise than saying obesity is simply increasing everywhere. Prevalence has plateaued or its rise has slowed in some high-income countries, while obesity is accelerating across many low- and middle-income countries. Prevalence and velocity answer different questions: a country may already have a very high prevalence but a slower current increase, while another country with a lower prevalence may be changing rapidly.
Children and adolescents
Figure 2. Velocity and prevalence of obesity among girls and boys, 1980–2024. Red indicates an annual increase in prevalence, green a decrease, and white little or no change. The upper maps show estimated velocity in 2024; the lower maps show age-standardized prevalence in 2024.
Adults
Figure 5. Velocity and prevalence of obesity among adult women and men, 1980–2024. These maps distinguish the countries with the highest current burden from those experiencing the fastest recent change.
Source and licence: NCD Risk Factor Collaboration (NCD-RisC), “Obesity rise plateaus in developed nations and accelerates in developing nations,” Nature 653, 510–518 (2026), https://doi.org/10.1038/s41586-026-10383-0. Figures reproduced without modification under the Creative Commons Attribution 4.0 International licence.
Start with the World Maps
These country maps group the major national obesity trajectories observed from 1980 to 2024. They provide a quicker geographic overview than the detailed circular timelines shown below.
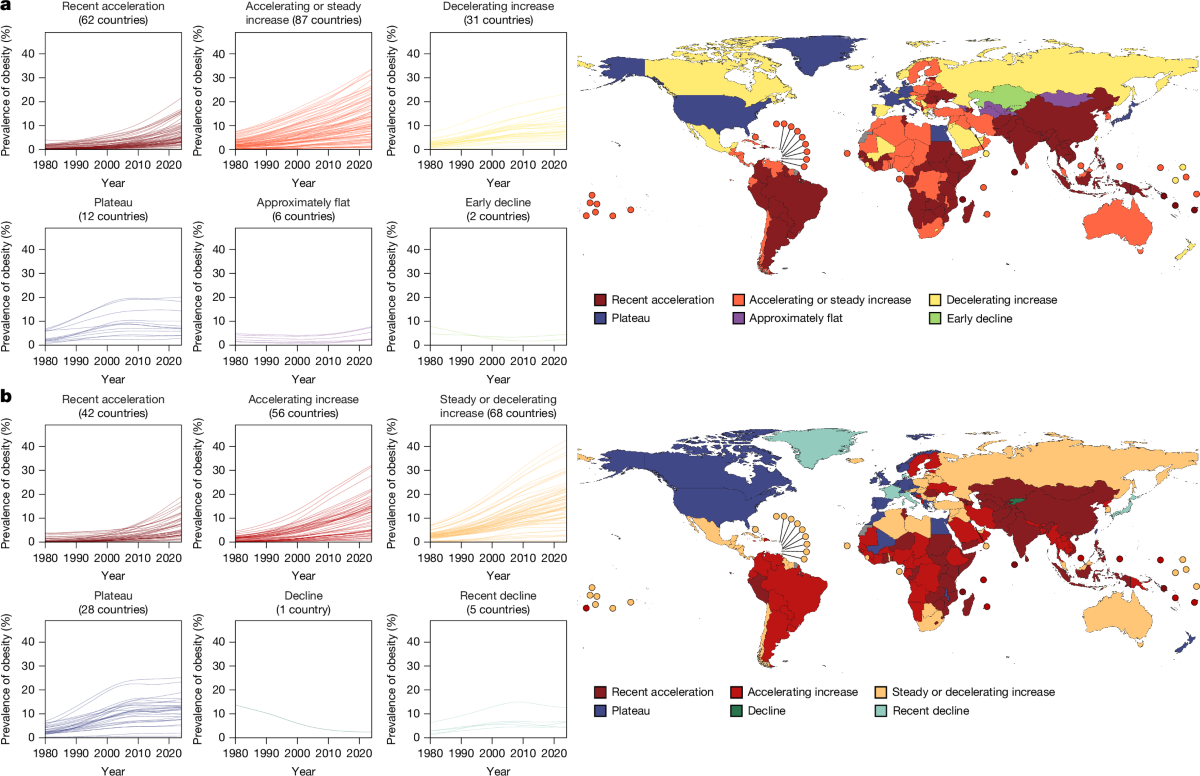
Children and adolescents: National obesity-trajectory patterns among girls and boys, 1980–2024.
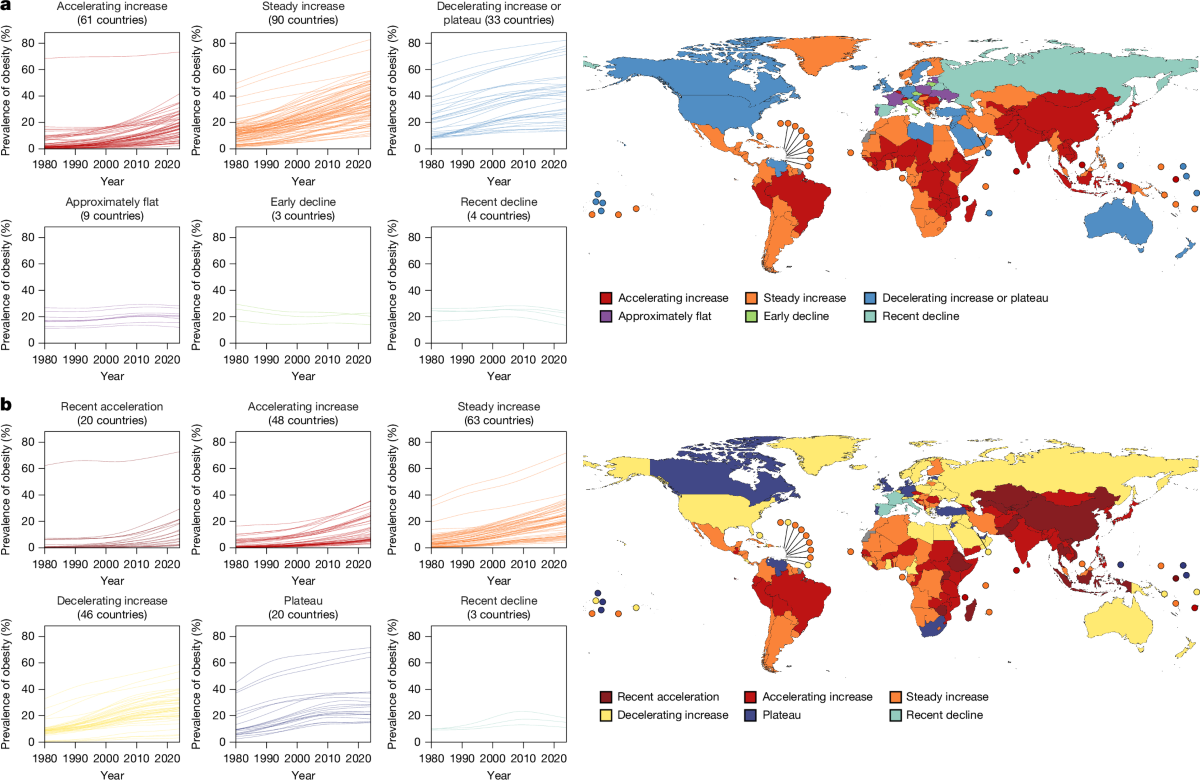
Adults: National obesity-trajectory patterns among women and men, 1980–2024.